Saturday, 31 December 2011

2011 is the second warmest year on record for the UK!

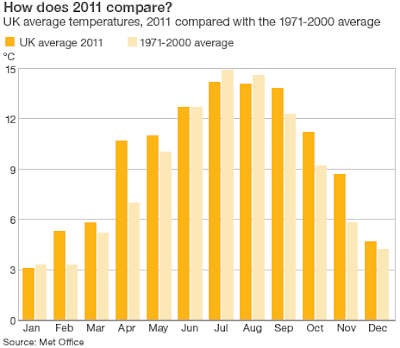
So maybe I lied a little bit in my last post, and I will squeeze another short post in before the New Year. I came across this news article last night on the BBC, where the Met Office data shows that the average temperature for the entire year has been 9.62C in the UK. This makes it the second warmest year on record, only narrowly behind 2006 where the average temperature was 9.73C. The graph below compares this years temperatures to the 30 year average between 1971-2000. The most notable differences are seen in the spring months.


Only two weeks ago the government granted a drought order to South East Water as the dry conditions between September and November have dropped water levels at the Ardingly reservoir in Sussex to just 12%! Nine of the top ten warmest years on record have all actually occurred since 1997, with the seven warmest all occurring in the last decade. In the news article Dr. Huntingford (climate modeller) states:
"As each year passes and we hear that a warming record has been broken, or nearly broken again, it provides further evidence that unfortunately we are not just seeing a natural cycle of global warming, and that instead humans are having an effect on the climate."
Well, I can now officially say that I'm signing off for 2011. Wishing you all a very happy (and mild!) New Year!
Thursday, 29 December 2011

2011 - A Year of Extremes, and More To Come...


Firstly, I hope you all had a great Christmas! It is this time of year that makes you really grateful for just the basic things in life. We are now fast approaching 2012 and is a good time to reflect on the past 12 months.

I don't think anyone can doubt that 2011 has had it's fair share of extreme weather events. December has seen the devastating monsoon in the Philippines that killed over 700, Scotland battered by a storm with wind speeds in excess of 165mph, whilst flooding in Kenya displaced thousands. November saw a mounting death toll in Cambodia after thousands were left stranded after monsoon conditions. In October residents fled Bangkok as flooding threatened to overwhelm the capital at the time when Texas was facing a dust cloud 8,000ft high, and the UK was facing it's highest October temperatures on record.  There was also the freak snow storm along the US east coast which killed 11 and left millions without power, only two weeks after hurricane Irene had ripped through the Caribbean and the south-east. September had seen even more destruction for Texas in which huge wildfires destroyed hundreds of homes. Going back to May, the world witnessed one of the most extraordinary tornado sequences ever caught on camera with more than 165 in just 24 hours in the Missouri area. March saw the most devastating natural event of the year in which Japan was hit by a double tsunami leading to 20,000 deaths and millions of pounds of damage. Cyclone Yasi has long been forgotten, but struck the Australian coast only back in February, tearing roofs of houses and bringing power lines to the ground. Going right back to the beginning of the year, January saw 400 killed as a result of torrential rain and mudslides in Brazil, there was flooding in Sri Lanka which forced 300,000 from their homes, as well as flash floods in Queensland.

Climate change sceptics may suggest that we are just becoming more 'aware' of extreme events since the 'global warming' hype of the 1980s but from research over the past few months, and the experience of extreme weather events in my lifetime I can only come to the one conclusion that anthropogenic climate change is a primary driving factor in the increasing frequency of these extreme events.

An extract from the Scientific American, dating back to June, summarises this nicely through the results of one of the worlds largest insurance companies Munich Re. The company has compiled the world's most comprehensive database of natural disasters, reaching all the way back to the eruption of Mount Vesuvius in A.D. 79. The records are kept with extreme interest by financial companies, in order to successfully evaluate insurance risks. On average 700-1000 natural disasters are added to the database each year. Their data shows a small increase in geologic events such as earthquakes since the 1980s, largely down to better reporting. However, increases in the number of climate disasters is 'far larger'

Peter Höppe, head of Munich Re's Geo Risks Research/Corporate Climate Centre:
 "Our figures indicate a trend towards an increase in extreme weather events that can only be fully explained by climate change... It's as if the weather machine had changed up a gear."

In the latest SREX report, we have seen the IPCC state:

"There is evidence that some extremes have changed as a result of anthropogenic influences, including increases in atmospheric concentrations of greenhouse gases."

Direct cause and effect literature has been hard to come by in the past, but this year has seen a significant increase not only in literature suggesting increasing likeliness of climate change on extreme events, but also as direct attribution. This does not mean however that every extreme event is a direct result of anthropogenic climate change. For example, solar forcing causing winter lows which I looked at in a previous post, can be assigned to natural variability. There has always been extreme events, and always will be as a result of natural variability, but the latest findings point to both an intensification and frequency of such events as a result of human impact. Over time with better climate model simulations, greater understanding of the hydrological cycle (specifically with vorticity and wind speed), and an increase in data collaboration and research papers, will I'm sure, only pile on greater evidence that extreme weather is slowly becoming the new normal (unless human anthropogenic impact is significantly minimised or reduced).

All I can conclude with is a warning: Extreme Weather Ahead.
Signing off for 2011.


Friday, 23 December 2011

Monsoons and Climate Change


After the devastating effects of Tropical storm Washi in the Phillipines earlier this week, I thought I would look further into any links between monsoons and anthropogenic climate change. It is well acknowledged that land use changes and human impacts through mining and illegal logging were a major cause in the flash floods, but 12 hours of continuous rain, in an area of the Philippines which storm tracks do not normally take is somewhat unusual. In an earlier post where I stated some of the latest finding form SREX, the tropical cyclone statement was one that particularly shocked me:
"It is likely that the global frequency of tropical cyclones will either decrease or remain essentially unchanged."
As a result I have done some digging to try and find other sources to these claims. I have come across two papers: one which looks at the evolution of Monsoons through the Holocene (12,000 years before present to modern day) using climate modelling, and another which assesses monsoon precipitation changes over the past 100 years.

The first paper deals with changes on the millennial time-scale and focuses on insolation forcing and feedbacks. It is found that the responses of the monsoons to the insolation forcing and oceanic feedback differ substantially among regions, because of regional features of ocean - atmosphere interaction. In the Northern Hemisphere, 'the models show a significant enhancement of all of the monsoons in the early Holocene and a gradual weakening toward the present'. The monsoons are enhanced in the Holocene by a positive oceanic feedback in North Africa and North America but are suppressed by a negative overall feedback in Asia.

The more recent second paper (July 2011) deals with changes on the decadal time-scale, over the past 100 years. Changes of global land monsoon precipitation are assessed by using three sets of rain-gauge precipitation data for the period of 1901-2002. It has been found that during 1901–2001, global land monsoon precipitation exhibits multi-decadal variations, with an overall increasing trend from 1901 to 1955, followed by a decreasing trend up to 2001. See the image below for the regional trends and Northern Hemisphere (NH) mean. There is uncertainty over changes in the 2000s.


Time series of precipitation anomalies for Northern Hemisphere land monsoon mean. (a) NH Mean (b) North African Monsoon (c) Indian Monsoon (d) East Asian Monsoon.


What does this all mean in brief?

The papers describe an overall weakening of monsoons on the millennial and decadal time scales, suggesting that anthropogenic warming of the past 200 years has not intensified them. I have looked in previous posts about how the intensification of the hydrological system can lead to more precipitation in some areas and decline in others, but I was not expecting such a significant downward trend of monsoons in the Northern Hemisphere over the past 40 years. It is a gentle reminder that ocean-atmosphere interactions are far more complex than we can imagine, and that despite SREX stating that heavy precipitation events will become more likely, it is unlikely that they will come through more extreme monsoon and tropical storm events. 

Moreover, it shows all the more clearly that land use changes can have such devastating effects on our planet, even without significant changes in weather patterns. The removal of the natural environmental buffer in the case of the Philippines has played a major role in the devastating effects and death toll, rather than an intensification of weather patterns.

Monday, 19 December 2011

In the News: Death toll from monsoon in the Philippines rises past 700

Tropical Storm Washi caused widespread flash floods throughout the Philippines 

The typhoon in south-east Asia dumped a month's worth of rain in just 12 hours on Friday, smashing homes and bridges, uprooting trees and carrying vehicles off in the torrent. The storm moved slowly out to sea yesterday, but more than 35,000 people flocked to hastily erected evacuation centresAn entire army division - some 10,000 soldiers - are involved in the rescue efforts around Cagayan de Oro, and many people are still missing.

During the peak of the rain, the water rose to about 11 feet (3.3m) in just a single hour. The Philippines are struck by about 20 major storms every year but most of them take a more northerly track, hitting Luzon island.

What was the real cause?

Lack of flood warning combined with darkness are partly to blame for the high death toll. Officials have also acknowledged that illegal logging and mining contributed to the storm's damage since there were fewer trees to hold water and prevent erosion.

Philippine Federal Environmental Official Nereus Acosta stated:
"We can really see how vulnerable we are. When you tamper with the watersheds and the forests, we become vulnerable."

This is an all to clear reminder that anthropogenic change of not just the atmosphere, but land can have devastating effects. More on the story can be found here.

Friday, 16 December 2011

2011 US Precipitation Record

It's getting to the time of year, where we can look back on events of the last 12 months and make comparisons to previous years on record. Thanks to the NOAA National Weather Service page you can create and plot precipitation maps and compare to yearly means with relative ease. I was able to create this image below within a few seconds, and if you have some time, why not try it out yourself:


The image displays 2011 mean precipitation (in mm) as departure from normal across the US. There are two key things to note: firstly, the extremely high rates of precipitation in the north-east US, and secondly, the extremely low-rates of precipitation in the south (500mm above and 500mm below respectively). I have touched on precipitation extremes in previous posts, but Philadelphia is now the wettest it's been since 1867 and there are 20 other cities who have broken long-term records or are close to. The increase in precipitation in 2011 has largely been down to the tornado outbreak in April/May combined with hurricane Irene and other heavy summer thunderstorm rains.

Now the heavy rains are only half the picture, sections of 16 states have precipitation rates 500mm below normal this year. It has been a significant year of contrast with many places being washed away with heavy rain and floods or whilst other areas have faced and suffered from significant dry conditions.

I have yet to really touch upon droughts in any of my posts, and now would probably be a good time to do so. Arnell (who's based at the Walker Institute for Climate System Research in Reading) in 2004 published this paper on climate change and drought, which has been recently built upon in the SREX report. Essentially droughts are likely to become more frequent and intensify with the intensification in the hydrological system. Precipitation in large parts of southern Europe, north Africa, central Asia and southern Africa (which are often subject to frequent dry conditions), are likely to experience even less rainfall, increasing drought risk. Moreover, the climate change risk is super-imposed on top of things such as land cover changes which could exacerbate the problem even further. It is well agreed upon that there will be an increased (physical) drought risk, but there is still considerable uncertainty over the magnitude of this change. 

The variability in climate change and precipitation is also displayed in a study released last month in which regional climate models were developed for Cyprus in order to project weather extremes. Despite, increases in temperature across the entire country (of 1-2 degrees Celsius in both summer and winter), some areas are expected to experience less frequent precipitation events of lower magnitude (inland places such as Nicosia) whilst other areas such as Saittas and Limassol may experience more precipitation events, with increased rainfall.

Climate change science predicts that if the Earth continues to warm as expected, wet areas will tend to get wetter, and dry areas will tend to get drier. Therefore you would expect this year's side-by-side extremes of very wet and very dry conditions in the US should become increasingly common in the coming decades. 

Wednesday, 14 December 2011

CO2 Climate Sensitivity Overestimated

CO2 emissions are a primary driver in climate change

A paper in Science published two weeks ago has suggested that climate sensitivity to carbon dioxide emissions is currently overestimated. The one line summary: 'the results imply a lower probability of imminent extreme climatic change than previously thought'. For more exact information read on...

Previous estimates suggest 3K change as the best estimate for doubling CO2 emissions, with 2 - 4.5K as the 66% probability range. The study combined extensive sea and land surface temperatures from the Last Glacial Maximum with climate model simulations; their results estimate a lower median of 2.3 K change in temperature, and reduced the uncertainty range to 1.7 - 2.6K (66% probability).

The uncertainty analysis is still incomplete and work will be done over the coming months to better consider things such as uncertainties in radiative forcings due to ice sheet extent, or different vegetation distributions. From their current estimates however, they seem certain that any climate sensitivities larger than 6 K seem implausible.

At the end of the day, a 2K rise in temperature will still have massive impacts on the natural and built environment, and will contribute to the intensification of the hydrological cycle, making extreme weather events more likely. It is however a gentle reminder that all future climate change scenarios and estimates are estimates and nothing more than that. With time I am certain that these uncertainties will be narrowed down even further. The authors stress that the results do not mean that the threat from human-induced climate change should be treated any less seriously. But seeing as there is very little being done about mitigating CO2 emissions, it means that we have a bit more time than previously thought.

Friday, 9 December 2011

Wind turbine explodes... because of too much wind!


You may recall in a very early post of mine that I stated 'more power can be generated in windier conditions' as an advantage of extreme weather events. However, for those who have watched the news in the last 24 hours, it turns out this may not be the case! 

Scotland was hit by a relatively extreme storm yesterday with wind gusts of up to 165mph recorded in the Cairngorms (the highest speeds in 25 years), coupled with localised flooding and heavy snow blasts, even the hardiest of Scots were put to the test (although I do recall one news report yesterday in which the interviewee described it as 'barbecue weather'!)

As of yet "climate models in general do not yield consistent or robust estimates of wind speed changes and the results were very uncertain" according to UK Climate Projections. As a result it is difficult to assign an event such as this to human-induced climate change or whether this is just one of the extremes that occurs naturally under a normal distribution of such event.

There was even an article published a couple of years ago in the Scientific American that climate change would bring about reduced wind speeds. You can find the article here. There is a non-linear trend between wind speed and power generated from a turbine. For example, a 15% increase in wind speed will output 50% more energy. Now for wind farmers across America, this statistic will be alarming, as a small reduce in wind speeds can result in a large loss of power. But as I've just said, their are extremely high levels of uncertainty.

What is certain is that the wind will always blow, but there is likely to be regional winners and losers.


Tuesday, 6 December 2011

Working Together Saving Tomorrow Today


Working Together Saving Tomorrow Today - COP17 Slogan

The 17th Conference of the Parties (or COP17) is now well under way (despite a relatively slow start) in Durban, South Africa. Since the UN Convention on Climate Change (UNFCCC) coming into play in 1995, the Conference of the Parties (COP) to the UNFCCC have been meeting annually to assess progress in dealing with climate change.

One of the major arguments to come out of the last 36 hours has been put forward by Health Minister Aaron Motsoaledi, addressing the first Global and Health climate summit (taking place alongside the main COP 17). He has stated that climate change will hurt governments’ "ability to maintain basic health".

The World Health Organisation (WHO) predicts that "changing climate conditions will lead to increases in malaria, cholera and dengue fever, as well as losses of life due to extreme weather events". The message is that health could be one of the first major casualties of climate change. As a result, The summit’s declaration calls on negotiating governments to deliver a binding agreement by 2014 which "places the protection of human health as a primary objective of any agreement". It also calls for a reduction in global greenhouse gas emissions to "avoid a global public health disaster".

However, it is argued that in the long term, the greatest health impacts may not be from acute shocks such as natural disasters, but from gradual build-up of pressure on the natural resources and social system that sustain health, which are already under stress in many parts of the world. It is widely accepted that African countries will be most widely affected by climate change, and therefore high up on the South African health ministers agenda. 

You can keep up to date with all the latest information out of Durban here. The conference ends on the 9th December.

Monday, 28 November 2011

Is Strange Weather in the Air or just On Air?

I came across this clip from NBC news last week which is probably one of the most one-sided reports on climate change causing extreme weather I've seen in recent weeks. It doesn't even try to balance the argument, or even suggest "on the other hand", which is surprising for a major US news network. It devotes a full 2 and a half minutes to suggesting that extreme weather events will become more likely and are a result of climate change. The video concludes by saying "today, no one can deny that extreme weather is here to stay"!


After doing a bit of digging in some journal archives, I came across this interesting paper. It looks at how extreme weather event coverage on US national television has changed over the past 50 years, and assesses whether news coverage can be used almost as a proxy as to whether extreme events are becoming more discernible.

News archives between 1968 and 1996 were used to track records of heat waves, droughts, hurricanes and floods from ABC, CBS and NBC television networks. A control period was used in order to distinguish between 'climate science' and 'global warming' frenzies that hit news and media in the late 80s. Some of the key findings are displayed on the graphs below:


Annual coverage of heat waves on the network news.


Annual coverage of floods on the network news.


Annual coverage of hurricanes on the network news.

The results show a dramatic increase in the coverage of floods and hurricanes since the 1980s, however, it must be noted that the different types of extreme events do not receive equal coverage: for example, annual peaks for droughts contain about twice as many stories as the peaks for heat waves. 

One of the key findings that the data revealed is that surprisingly there is no association between coverage of climate change and the overall coverage of extreme events. They also discovered that whilst total news coverage of extreme events in the US increases dramatically, coverage devoted to extreme events in other countries remains relatively constant (see image below).


Index of extreme weather coverage on the network news by all events and foreign events.

There are a variety of limitations with using a study such as this to show extreme events are linked to anthropogenic change. Media is always subjective and some news stories can be made at the expense of others. Some stories can often dominate the news, whilst others get left behind. Changes in technology, forecasting and the ability to track extreme weather events has also come a long way in the last 50 years and the ability to cover events and show footage will impact whether an event is covered.

Despite not a lot of concrete evidence coming out of reports such as these, it is pleasing that researchers are trying new and innovative ways of collating evidence for climate change.

Wednesday, 23 November 2011

Incredible Photos of Extreme Weather

I came across this website today which has a collection of some amazing photos of extreme weather events. It is well worth a quick look if you have a couple of minutes spare. They quite literally take your breath away! Here's a couple of my favourites from the site:


Monday, 21 November 2011

IPCC Special Report - Latest Findings on Extreme Weather Events

The report suggests that droughts will intensify during the 21st century


Working Groups I and II for the IPCC have produced a special report for 'Managing the Risks of Extreme Events and Disasters to Advance Climate Change Adaptation' (SREX for short). The findings of the Special Report were presented at the IPCC's 34th session, which is currently being held in Kampala, Uganda. The full report is not available until February 2012, but a 29 page summary has been made available and can be downloaded here.


I've listed some of the key findings below, but I would urge you to take a look at the full report yourselves:

> "A changing climate leads to changes in the frequency, intensity, spatial extent, duration, and timing of extreme weather and climate events, and can result in unprecedented extreme weather and climate events."

> There is evidence that some extremes have changed as a result of anthropogenic influences, including increases in atmospheric concentrations of greenhouse gases. It is likely that anthropogenic influences have led to warming of extreme daily minimum and maximum temperatures on the global scale.

> "It is likely that the frequency of heavy precipitation or the proportion of total rainfall from heavy falls will increase in the 21st century over many areas of the globe."

> "Average tropical cyclone maximum wind speed is likely to increase, although increases may not occur in all ocean basins. It is likely that the global frequency of tropical cyclones will either decrease or remain essentially unchanged."

> "There is medium confidence that droughts will intensify in the 21st century in some seasons and areas, due to reduced precipitation and/or increased evapotranspiration."

> There is high confidence that changes in heat waves, glacial retreat and/or permafrost degradation will affect high mountain phenomena such as slope instabilities, movements of mass, and glacial lake outburst floods.

The summary is very cautious with it's findings and confidence levels, stating that "Extreme events are rare, which means there are few data available to make assessments regarding changes in their frequency or intensity." As has been discussed in previous posts and seen in the current academic literature, it becomes very difficult to isolate a single event, like a heatwave or a heavy rainstorm, and say that event was caused by the human element of climate change.

Despite this, the report is yet another contribution to the scientific community suggesting that anthropogenic impacts are having a direct impact on extreme weather events.

Tuesday, 15 November 2011

Extreme Winters Caused by natural Solar Cycle?

Living not far outside of London growing up, the idea of a thick blanket of snow to play in on a winter's day was only ever a distant fantasy. You see it in the American movies all the time, and you soon learn that a 'white Christmas' doesn't really exist. When the snow fell in 2009, my inner child only had one thing in mind!


What's the significance of this? Well, it was the coldest winter on record in over 25 years, and the UK received record levels of snow. It would be easy to throw climate change to an extreme anomalous event such as this, but recent findings suggest an alternative...

Climate scientists at the UK Met Office have recently carried out a new study on the fluctuations of the sun's UV radiation. They attempted to create a link between solar activity and seasonal weather.

Satellite measurements were used and fluctuations in solar radiation were discovered to be five times as large as previously thought. They put their data into the Hadley Centre model and were able to show how these fluctuations affected regional weather.

The paper emphasises that there findings do not suggest a link to long-term global warming, rather that there is a real correlation between ultraviolet levels and meteorological variables. They show that there is actually little direct change in globally averaged temperatures as the solar activity drives cold winters in northern Europe and the United States, but mild winters are subsequently found over southern Europe and Canada.

How does it work?

UV is absorbed in the stratosphere (the upper atmosphere) by ozone. When there is less UV to absorb, the stratosphere is relatively cooler. The Hadley centre model shows that the effects of this percolate down through the atmosphere. It is described in the paper as a 'top-down stratosphere to troposphere pathway'. As it does this, it changes wind speeds, including the jet stream that circles the globe above Europe, Russia and North America. The resultant change is a reduced air flow from the west to the east, moving colder air into the UK and northern Europe. The image below shows these changes in wind speed and pressure between Ocotber and March 2010. There is then a re-distribution of temperatures across the region, leading to the milder winters in southern Europe and Canada.

Is it quite as clear cut?

The scientists suggest that other factors may have been at play for the colder winter temperatures, including the decline of sea ice levels and El Nino. In all honesty, it could be any combination of these factors, but they suggest that the solar cycle was acting in a way to facilitate these conditions.

What's the advantages of this (other than building giant snowmen)? 

The UV measurements could be used for better forecasting. UV levels won't be able to tell us what the day-to-day weather will do, but it would enable improved forecasts for winter conditions months ahead. They would play an important role in long-term contingency planning.

In summary, the winter weather seen across the UK and Atlantic between 2009-2011 appears to back up the scientists findings. The next stage of investigation would be to look at UV measurements across a longer time-scale, to see if the patterns hold true.

Monday, 7 November 2011

165 Tornadoes in 24 Hours


The weather witnessed in Southeast US earlier this year was phenomenal. Over 600 tornadoes were recorded in April alone, breaking the previous record by several hundred. Numerous F5 tornadoes (the highest grade) with surface wind speeds greater than 200mph were also witnessed. The result was widespread and devastating destruction, including the deaths of more than 350 people. In Alabama, between 1950 and 2006, 358 people have been killed as a result of tornadoes. In the 30 day period of April 2011, 240 people were killed in Alabama.


Why so many tornadoes?

The high number of tornadoes was partly due to the Arctic Oscillation which was in a negative phase. High pressure in northern Canada, pushed the cold arctic air a long way south. On top of this, the sea surface temperatures in the Gulf of Mexico were a couple of degrees above where they should have been for the time of year.  The resulting evaporation meant warm humid air residing off the southeast coast of the US. A southerly breeze, brought this warm humid air inland, and mixed with the cold air, creating a very active weather front. In this situation, the warm air rises up above the cold air and it begins to interact with the jet stream. The jet stream was further south than it should have been and this is partly due to the La Nina phase of the ENSO oscillation. As the warm air rises and meets the cold air, almost instantaneously as a thunderstorm develops, you get the twisting motion as a result of the cold and warm air meeting with the jet stream. The twisting motion produces the tornadoes which then eventually reach the surface. The image below shows the air movements and tornado reports across April 2011.


The daily evolving 500mb heights (contours) and 850mb wind (arrows) from April 1-30, 2011.  Index: category 4 (orange) indicative of enhanced severe storm risk and category 5 (red) indicative of enhanced tornado risk. Source


A paper published in 2008 looked at whether tornado counts change location based on phase of El Nino/ Southern Oscillation. However, results found that neither frequency of tornado days nor days of violent tornados is affected systematically by the phase of ENSO for the US as a whole. Rather that ENSO only sets a ‘background stage’ for which tornado activity to occur in.
“The apparent response of organized tornado activity to ENSO phase is a nonlinear one driven by meteorological processes rather than conditions in the tropical Pacific. Neither ENSO extreme (warm nor cold phase) is related to as significant of an increase in organized tornado activity as the intermediate neutral phase is.”
Currently further research is required into the contribution of La Nina, and NOAA observational sources suggest that the tropical sea surface temperature conditions played a much larger role in what was witnessed in April 2011.


Anthropogenic Climate Change and Tornadoes

In order to assess long term climate trends, reliable long term data is required, which makes the assessment of tornadoes and climate change difficult. The US Climate Change Synthesis Report SAP 3.3 concludes that:
"The data used to examine changes in the frequency and severity of tornadoes and severe thunderstorms are inadequate to make definitive statements about actual changes."
"There were no significant changes in the high-intensity end of these distributions from the 1950s through the 1990s, although the distribution from 2000 and later may differ."

The historical record of tornado counts should always be treated with care. In some states, tornado counts have doubled in the last two decades, but this may be due to non-meteorological changes. Changes in use of equipment which result in large numbers of F0 (weakest) tornadoes being recoded which previously weren't, account for this rapid change in the recent totals (see records from Illinois below). Population growth and spotter networks also increase the amount of tornadoes witnessed and reported. Death tolls are also not necessarily that useful. In May 2004, 384 tornadoes were recorded, but only 7 deaths. In 2008, only 40 tornadoes are on record, but more than 100 people were killed. The high death toll years are often a result of just several tornadoes hitting urban centres with high populations.

a)

b)
The annual number of tornadoes per year in Illinois since 1950, regardless of strength (a) and F0 only (b). Source
"There is insufficient evidence to determine whether trends exist in.....small-scale phenomena such as tornadoes, hail, lightning and dust-storms."

Another paper on the analysis of climate change projections suggests that the number of days during which meteorological conditions are favourable for severe storms may increase during latter decades of the 21st Century, primarily due to increased instability as a result of anthropogenic forcing. However, the research projected decreases in vertical wind shear, which as a result may oppose thermodynamic destabilization. In such a case, there may not be a discernable link between tornados and climate change, which rely on increases in wind shear to form.

In summary, more research is clearly required to better understand how ENSO and its multi-year life-cycle may influence the probability of major, destructive tornado outbreaks over the US. The relation is likely to be more complicated than the simple state of the tropical Pacific sea surface temperatures. There is a large body of knowledge rapidly evolving over the possible role of large scale climate forcing caused as a result of anthropogenic impact, on tornado outbreaks. In order for this to be more successful, efforts need to me made in linking meso-scale meteorology with global-scale climate dynamics. Watch this space...

Monday, 31 October 2011

In the News: Snowstorm hits US East Coast... in October!?!


Record levels of snow were recorded on the East Coast of the US yesterday. According to the National Weather Service, 31.4 inches fell in Jaffery New Hampshire. The storm blanketed New York city's Central Park with 3.3cm (1.3in) of snow, almost doubling an 86-year-old record set on October 30, 1925. The storm caused chaos, killing 9 people and leaving over 3 million homes without power (The full story and news video can be found here).

In trying to find some up to date information on this storm and any links to climate change I came across a blog called 'Weather Underground' which is written by meteorologist Dr. Jeff Masters. It is well worth a look and keeps up to date with all the latest notable weather events across the world.

Jeff states on his blog that the recent snows do not, by themselves, demonstrate anything about the long-term trajectory of the planet. "Climate is, by definition, a measure of decades and centuries, not months or years." But Dr. Masters also re-emphasises that government and academic studies have consistently predicted an increasing frequency of just these kinds of record-setting storms, because warmer air carries more moisture.

Floods in England Caused by Anthropogenic Greenhouse Gases


Scenes such as those in Uckfield in the above video were witnessed all across England and Wales in October and November 2000. It had been the wettest autumn since records began in 1766 - the map below outlines total rainfall and percentage increase above average for the time of year. Over 10,000 properties were flooded and the costs as a result of the damage exceeded £1bn.


In a recent paper published in Science, a group of scientists have been attributing flood risk and anthropogenic climate change as a result of the extreme events in 2000. As mentioned in previous posts, only general explanations are usually offered for any expected increase in flooding. They usually revolve around thermodynamic arguments for precipitation extremes, an example of which can be found here.

In this recent paper a seasonal-forecast-resolution climate model was used to create two scenarios. One realistic scenario whereby actual twentieth century climate was modelled (including atmospheric pollutant concentrations) and a second hypothetical scenario to represent climatic conditions as they might have been had anthropogenic greenhouse gas emissions not occurred. Atmosphere-ocean linkages were taken into account alongside sea surface temperatures and sea ice cover. The scenarios could then be run multiple times and runoff rates could be compared between natural and anthropogenic conditions.

The study outlines that there were sequences of intense weather systems bringing heavy precipitation pulses to catchments multiple times throughout the day in Autumn 2000. This was characterised by the displacement of the North Atlantic jet stream (see image below) bringing more intense systems further into western Europe. 


This resulted in many catchments becoming saturated. Daily river runoff was examined using a simple hydrological runoff model and the climate scenarios were compared.


The above diagram is a summary of their results, showing that the fraction of risk attributable to twentieth century greenhouse gases are significant relative to the natural conditions (without anthropogenic impact). The black line is an aggregate relative to the full natural baseline conditions.

Model Results:
In nine out of ten cases, the model results indicate that twentieth century anthropogenic greenhouse gas emissions increased the risk of floods occurring in England and Wales by more than 20%, and in two out of three cases by more than 90%.

These results are yet another step towards providing evidence of how extreme weather events are a direct result of human anthropogenic change. But again I will give a word of caution - changes in built environment (concrete over natural environments) could have played a part in historical model simulations in recent years (affecting both run-off and return time). Furthermore, just because an event-type becomes more likely, does not meant that it will become even more likely in the future - but it does highlight the potential impact of climate change..